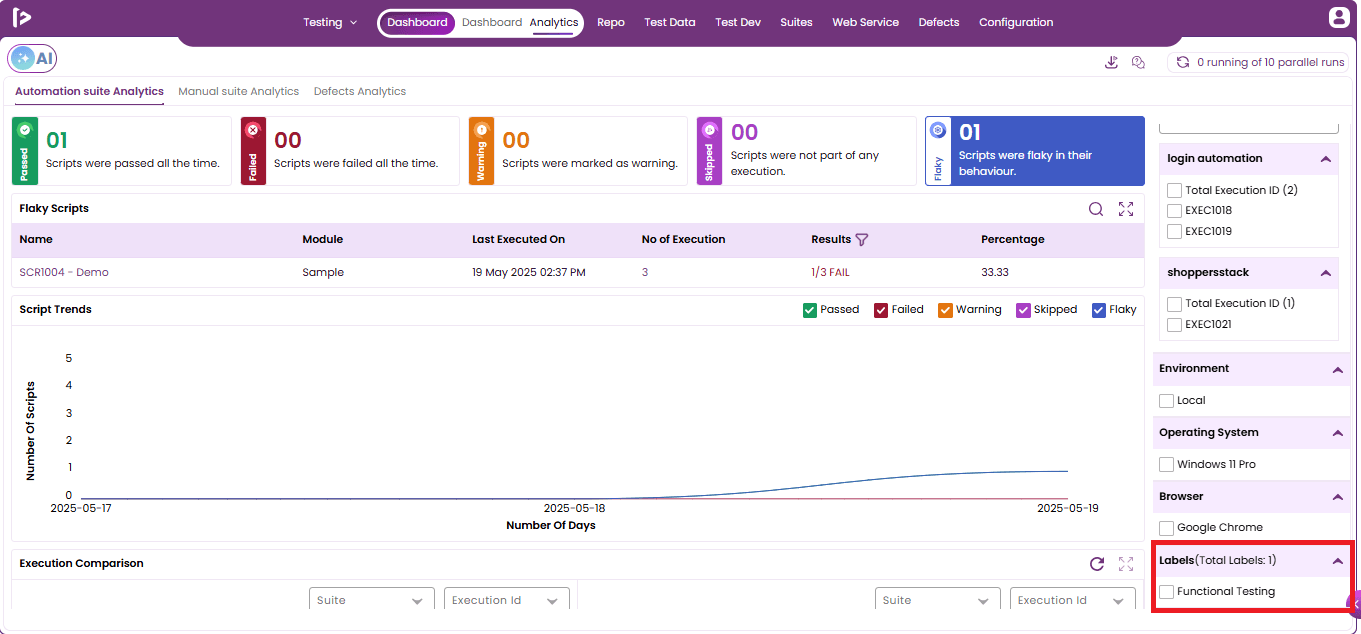
Automation Suite Analytics
Automation Suite Analytics refers to the tracking and reporting of automated test execution metrics. It provides visibility into the effectiveness, stability, and performance of your automation suites, helping teams make smarter testing and release decisions. Automation Suite Analytics refers to the process of collecting, analyzing, and visualizing data from automated test executions in order to measure test performance, identify issues, and improve software quality over time. Automation Suite Analytics is a data-driven approach to tracking how well your automated tests are performing across builds, environments, and time.
- Early detection of regressions.
- Data-driven release readiness.
- Improved test coverage visibility.
- Faster debugging with failure patterns.
- Helps QA leads and managers with reporting and audits.
Pre - requisites
Automation suites should be created.
Navigation
All Projects > Individual Projects > Top navigation bar > Dashboard > Analytics > Manual Suite Analytics
Steps to navigate to Automation Suite Analytics
- As soon as the user logged in, they will be navigated to All projects level.
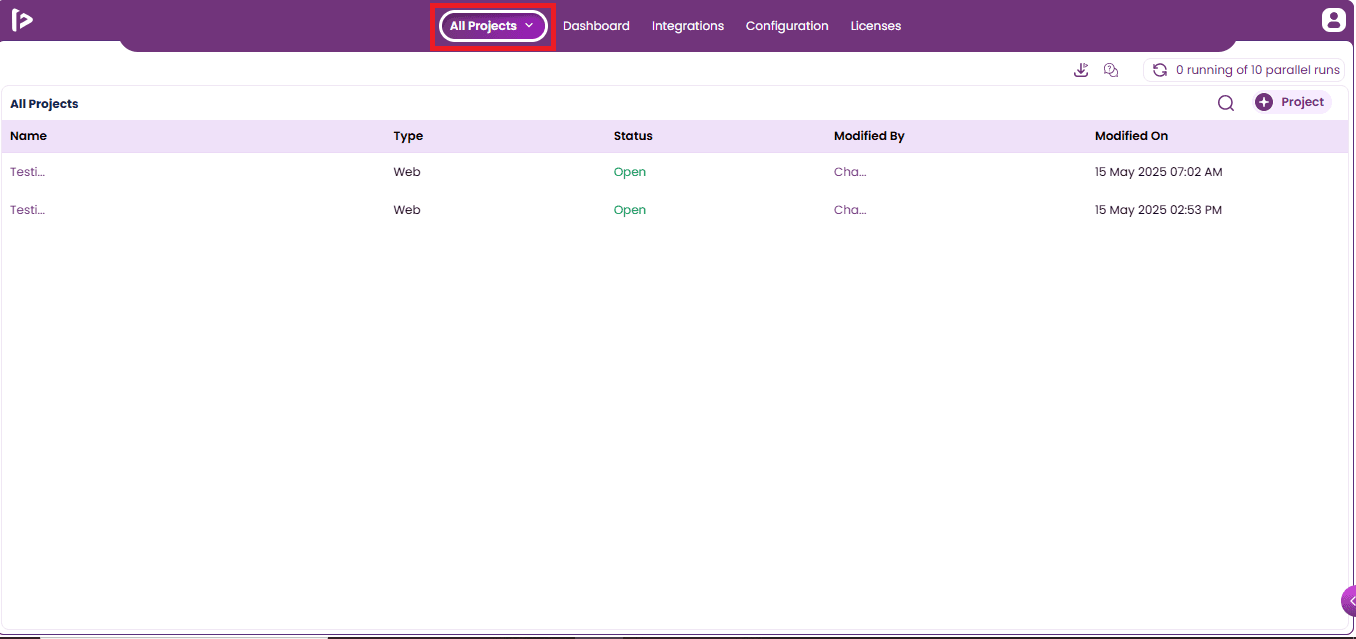
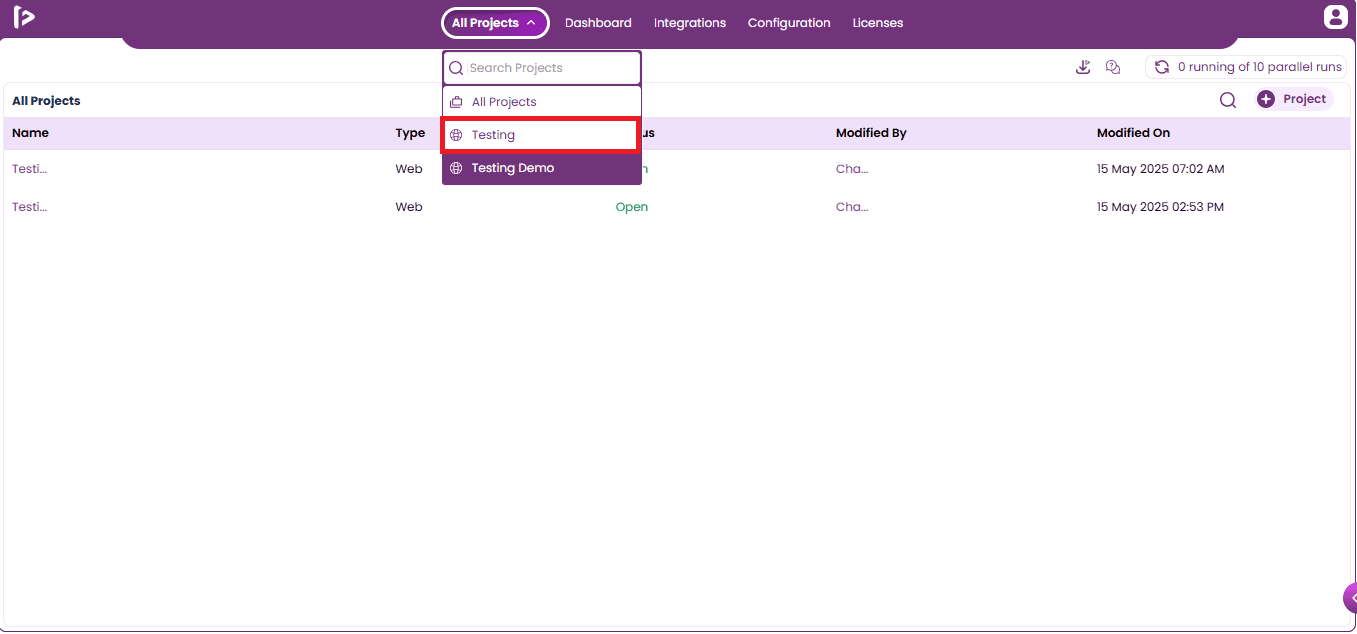
- Select the desired project from the options.
- The user will be navigated to the individual project level, where the user can click on the Dashboard section, as shown below.
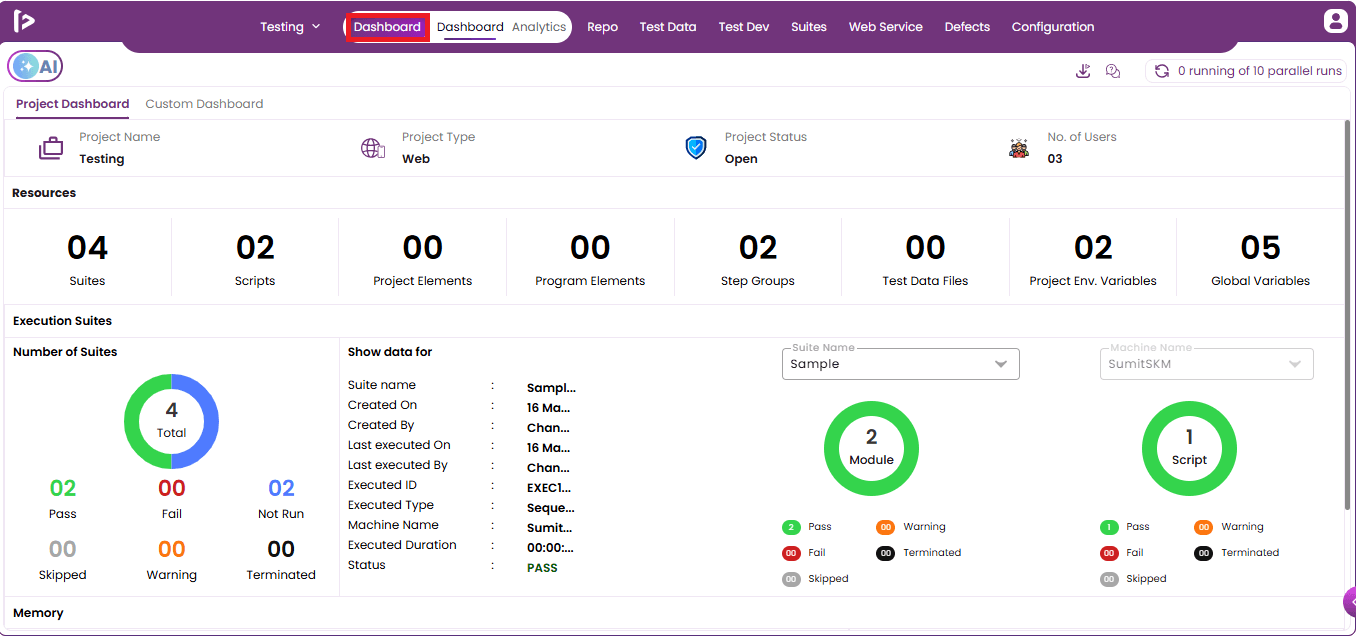
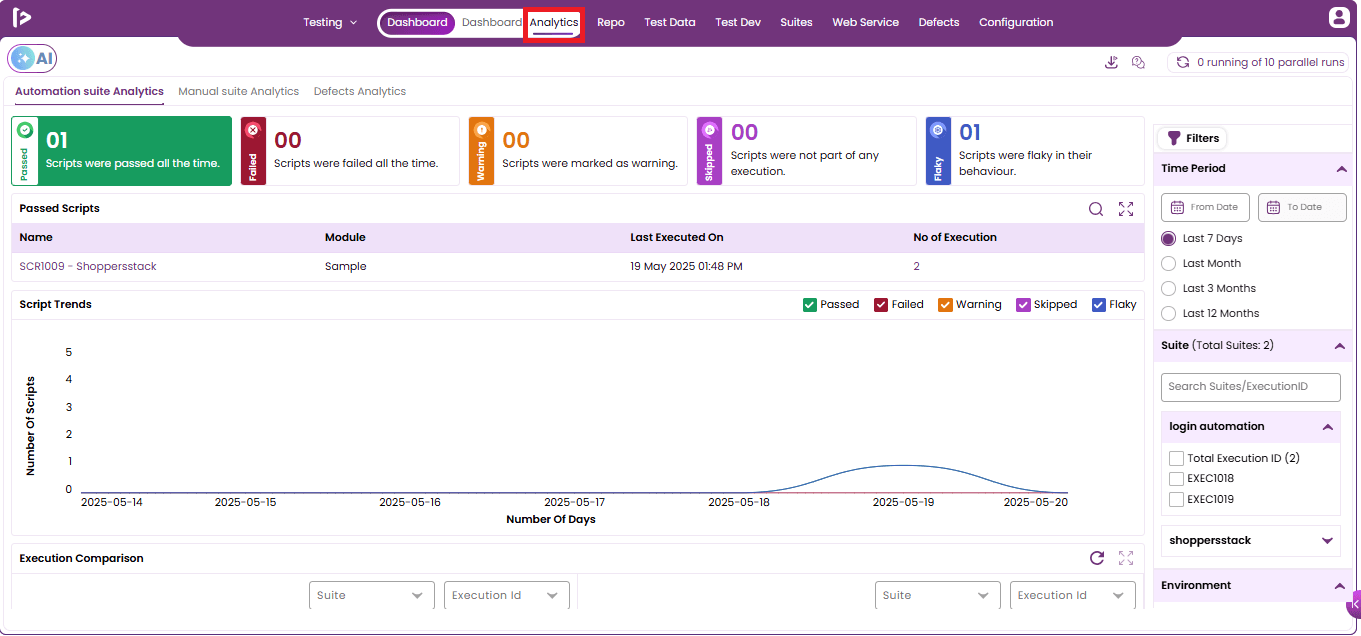
- Click on the Analytics option in the Dashboard section.
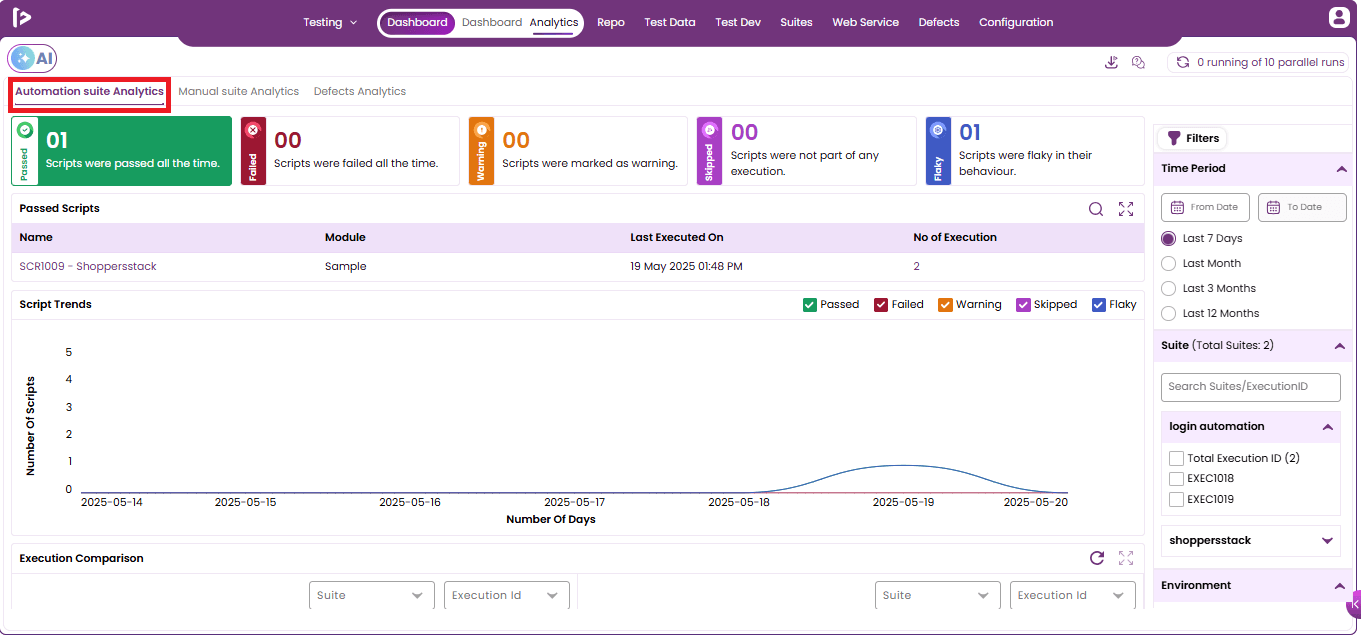
- Click on the Automation suite analytics option in the Analytics section.
Analytics Details
Cards : In the Automation Suite Analytics module of FireFlink, a card is a dashboard element that visually summarizes key metrics or insights related to automated test executions. These cards help users quickly monitor test performance, identify trends, and assess release readiness. It represents the Execution status of the automation suites. The following are the 5 execution statuses.
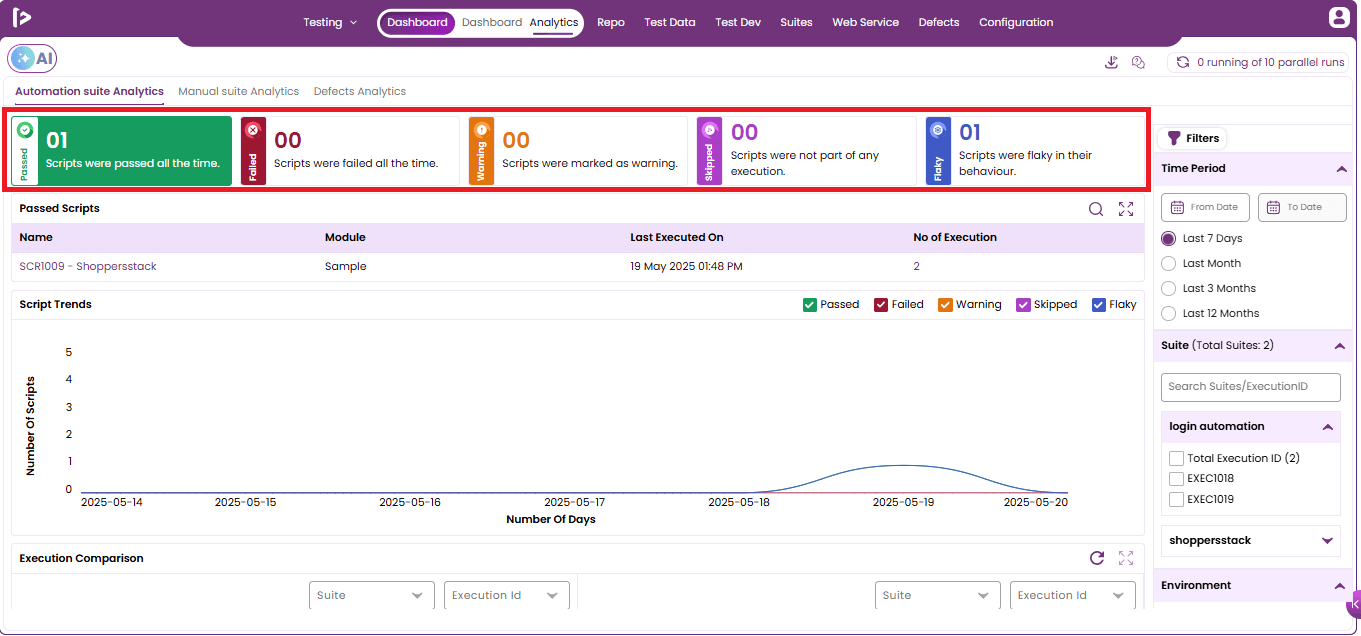
1. Passed - The "Passed Card" in FireFlink shows how many automated tests passed and helps teams quickly gauge the stability of a build or suite.
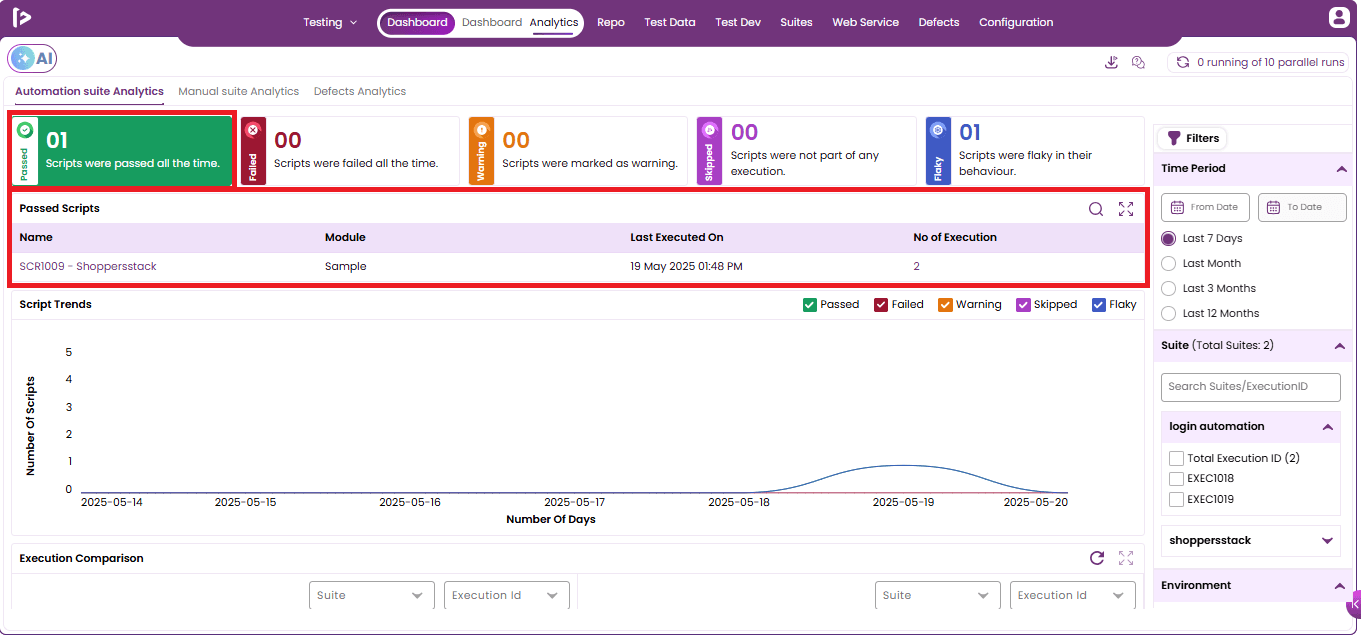
If user wants to check the Passed steps, they can follow the steps mentioned below
- Click on the number in the No of execution.
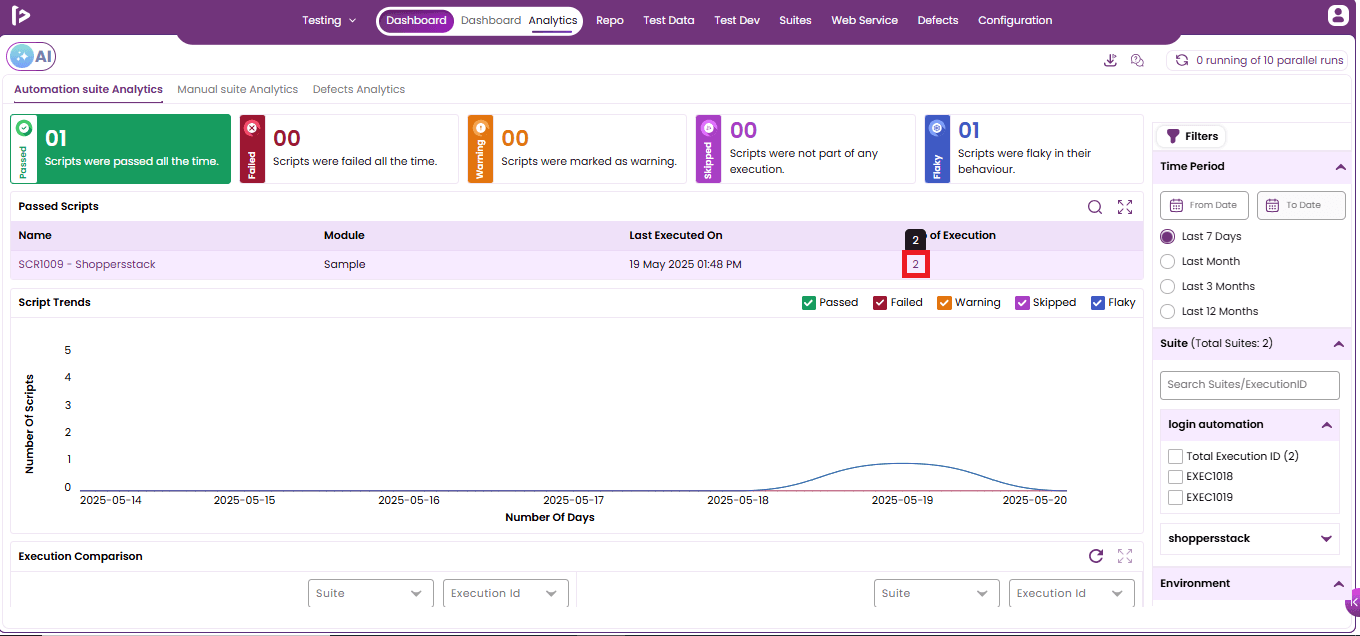
- After selecting the number, the user will navigate to the module level passed slider. Then select the Passed option.
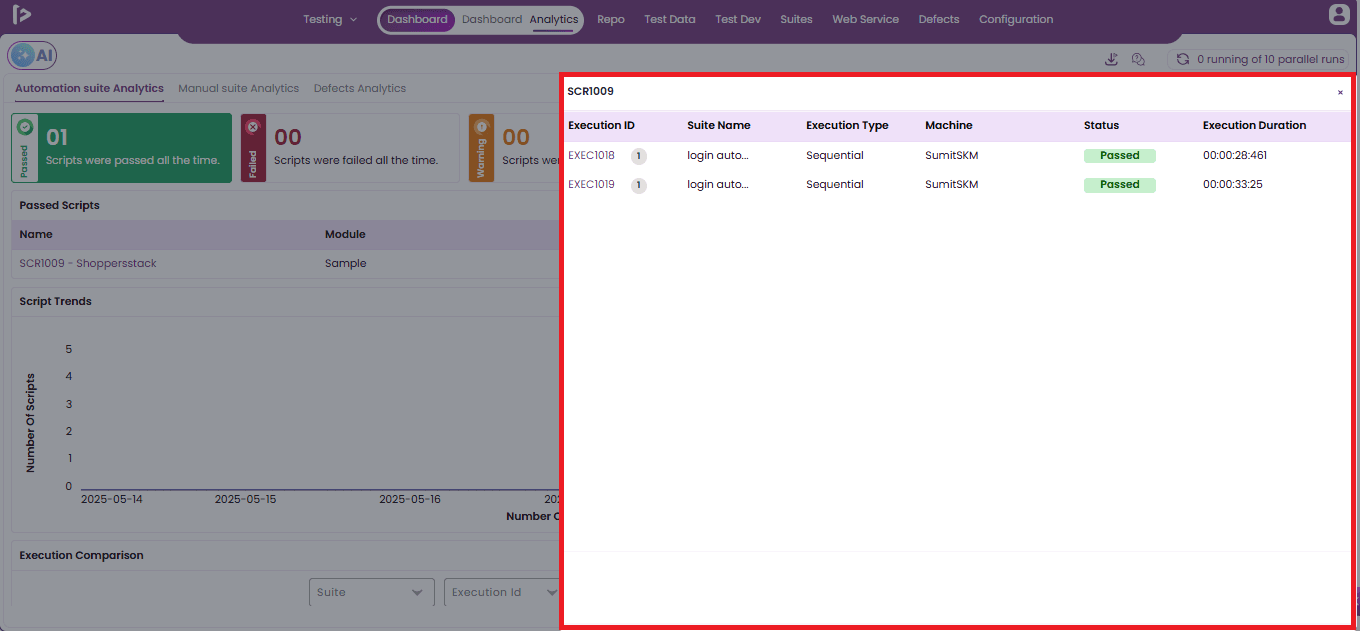
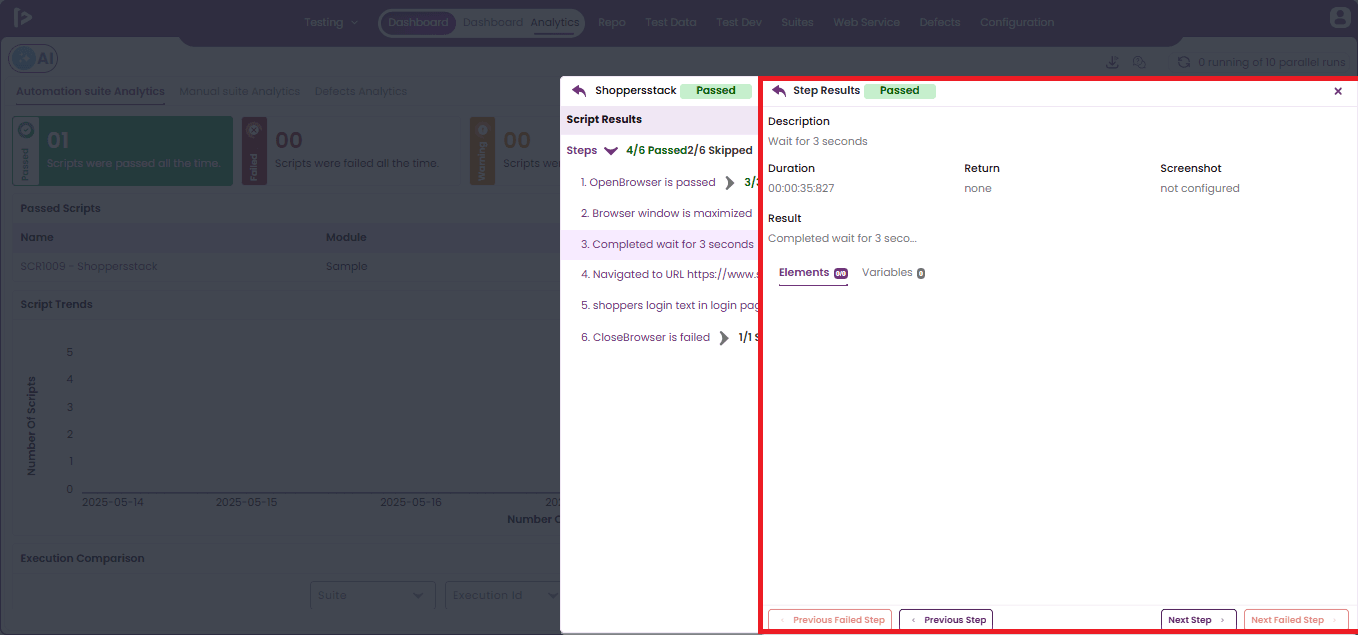
- If the user does the action another 2 times, then they will navigate to the step level passed slider.
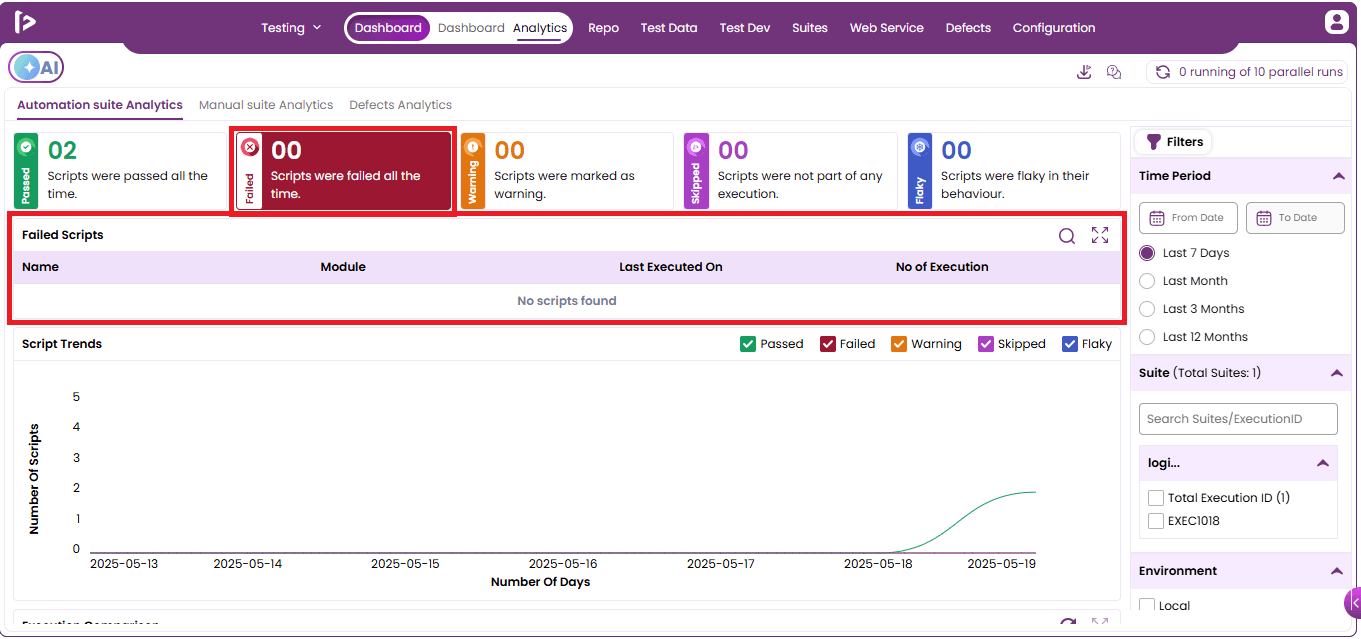
2. Failed - A Failed Card in FireFlink represents an individual test or script component (often shown as a card in the UI) that failed during execution due to an error, unmet condition, or assertion failure.
3. Warning - In FireFlink, a "Warning Card" represents a step or validation within a script that did not fail completely, but raised a warning due to unexpected behavior, potential issues, or soft assertion mismatches.
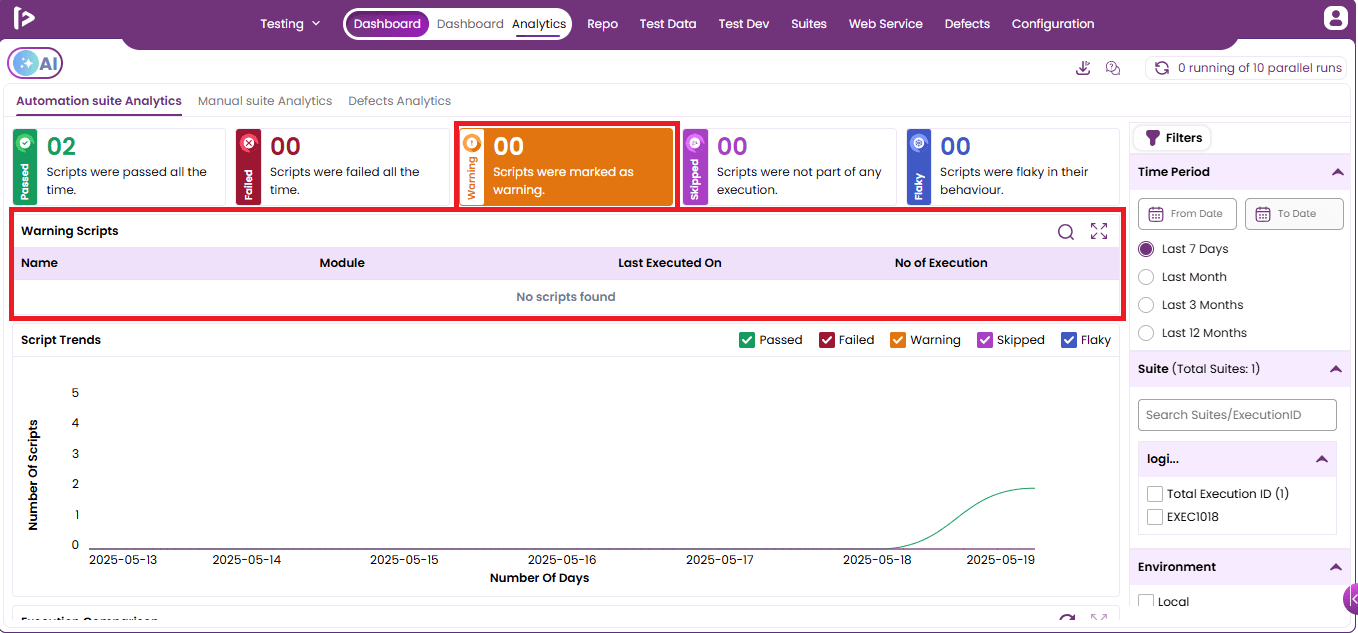
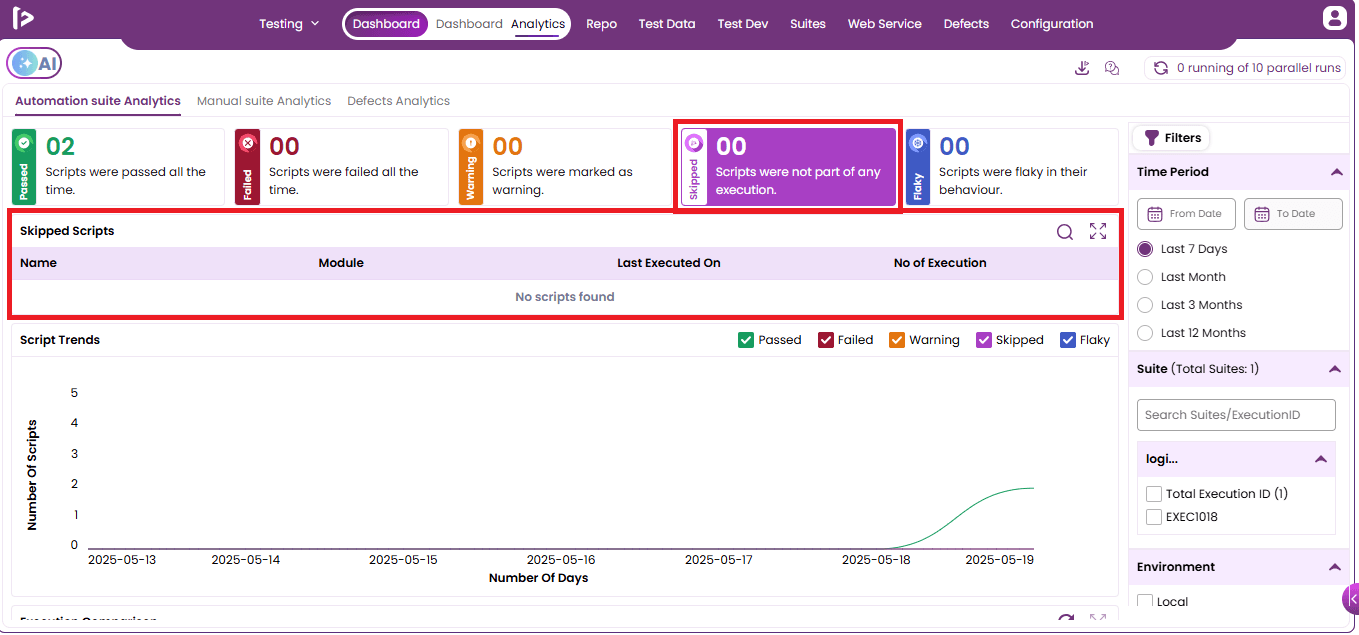
4. Skipped - The "Skipped" Automation Suite Analytics Card displays the number of automation runs or test cases that were not executed during a suite run. These are typically skipped due to unmet conditions, dependencies, configuration settings, or manual exclusions.
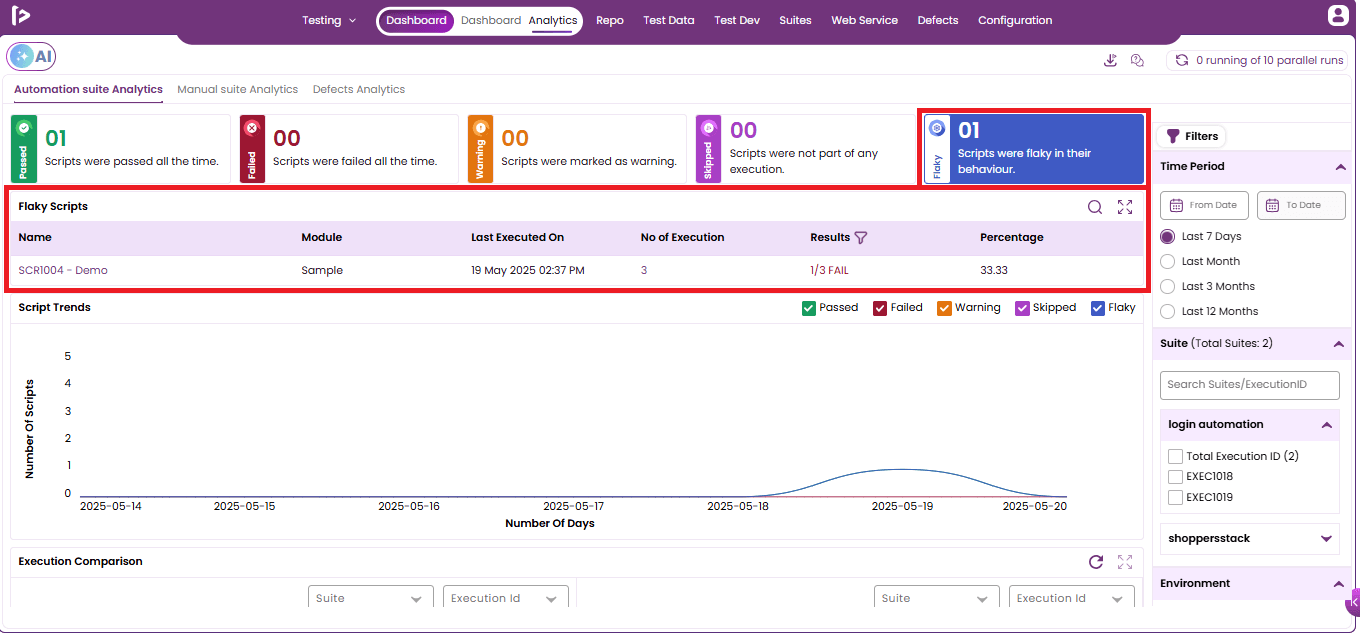
5. Flaky - A Flaky Card is a step within a script that does not produce consistent results, indicating that the issue may not be with the test logic itself but with external factors like data, timing, environment, or network stability.
- Columns under Cards are as follows;
- Name - It indicates the name of the suites of every execution status.
- Module - It indicates in which module the test case is located and selected for the suite.
- Last Execution on - It indicates that when the particular suite got executed recently.
- No of Execution - It indicates how many times the particular suite execution is done.
- Results - This column comes under Flaky suites only. It indicates what the result of the suite that the user got after execution.
- Percentage - This column also comes under Flaky suites. It indicates the percentage of the suites that are getting passed or failed.
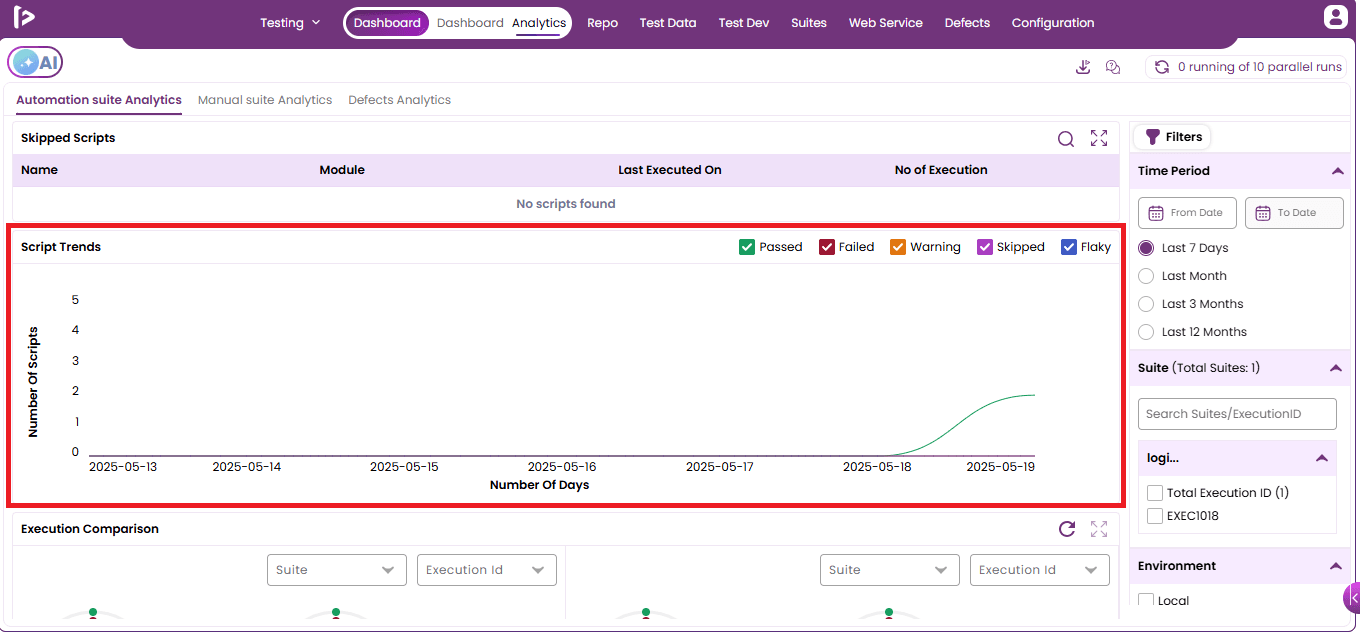
Script Trends : Script Trends provide a visual and data-driven overview of how automated test scripts are performing over time within an automation suite. This includes metrics such as: Pass/fail rates across multiple executions; Script execution frequency; Stability trends (e.g., consistently failing or flaky scripts); Execution duration per script. The graph shows the relationship between the number of scripts that are executed in the particular number of days.
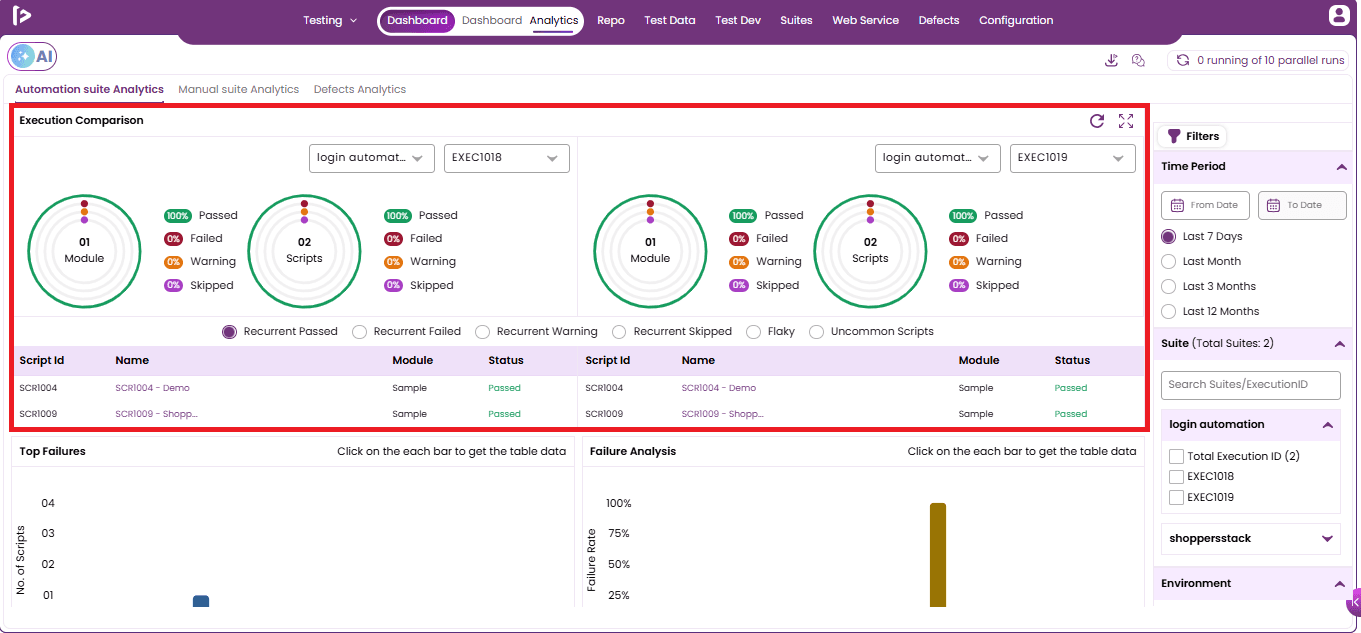
Execution Comparison : In FireFlink, the Execution Comparison feature is designed to help you analyze and compare different executions of the same test suite. This functionality is particularly useful for identifying trends, regressions, or improvements over time. Choose the test suite you wish to analyze. Within the suite's analytics, you can compare different executions by their Execution IDs. This allows you to see how the suite's performance has changed over time.
- Columns under Execution Comparison are as follows;
- Script Id - It represents the ID of the script.
- Name - It indicates the name of the script.
- Module - It indicates the module from which the script was selected. For both the columns, modules will be the same.
- Status - It indicates the status of execution of the suite.
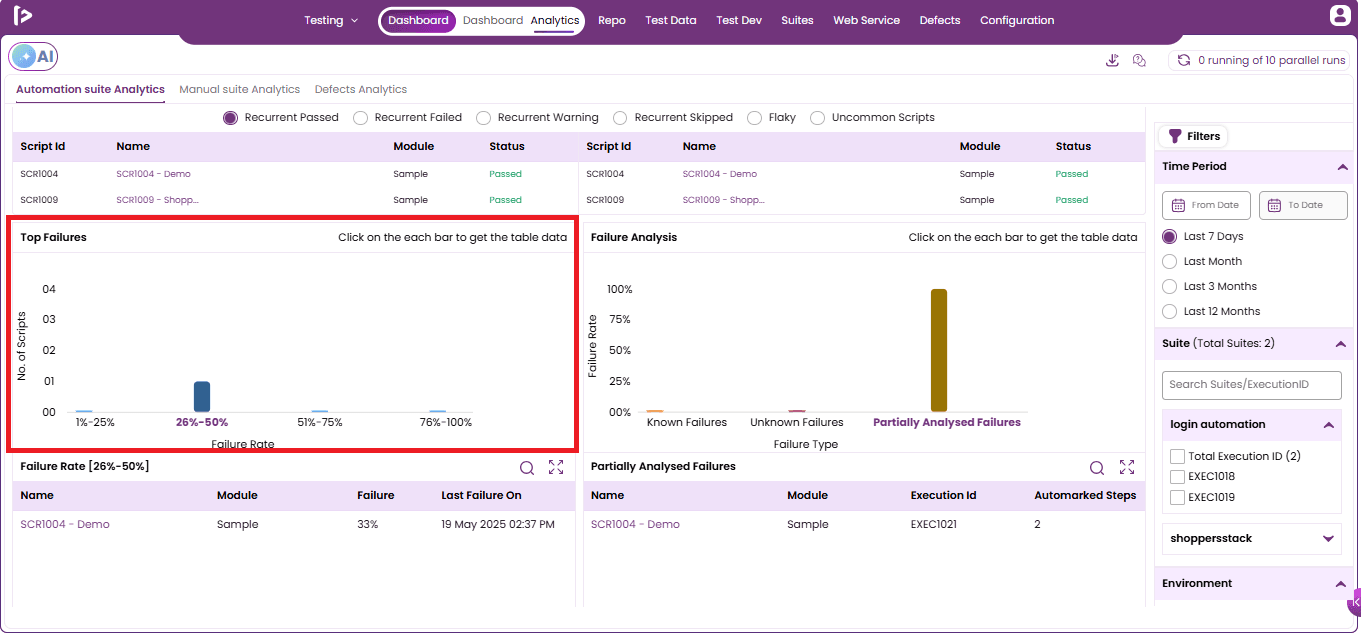
Top Failures : In FireFlink, identifying and analyzing the top failures within your test suites is crucial for maintaining robust and reliable automation. Choose the test suite you wish to analyze. Within the suite's analytics, you can view the Top Failures section. This area highlights the most frequent and impactful test failures, allowing you to prioritize them for resolution.
Failure Analysis : In FireFlink, Failure Analysis is a comprehensive feature designed to help you diagnose, understand, and resolve test failures efficiently. By leveraging AI-driven tools and detailed analytics, FireFlink streamlines the debugging process, enabling faster identification of issues and improved test reliability. Within the suite's analytics, you can access detailed failure analysis, including visual representations and error statistics.
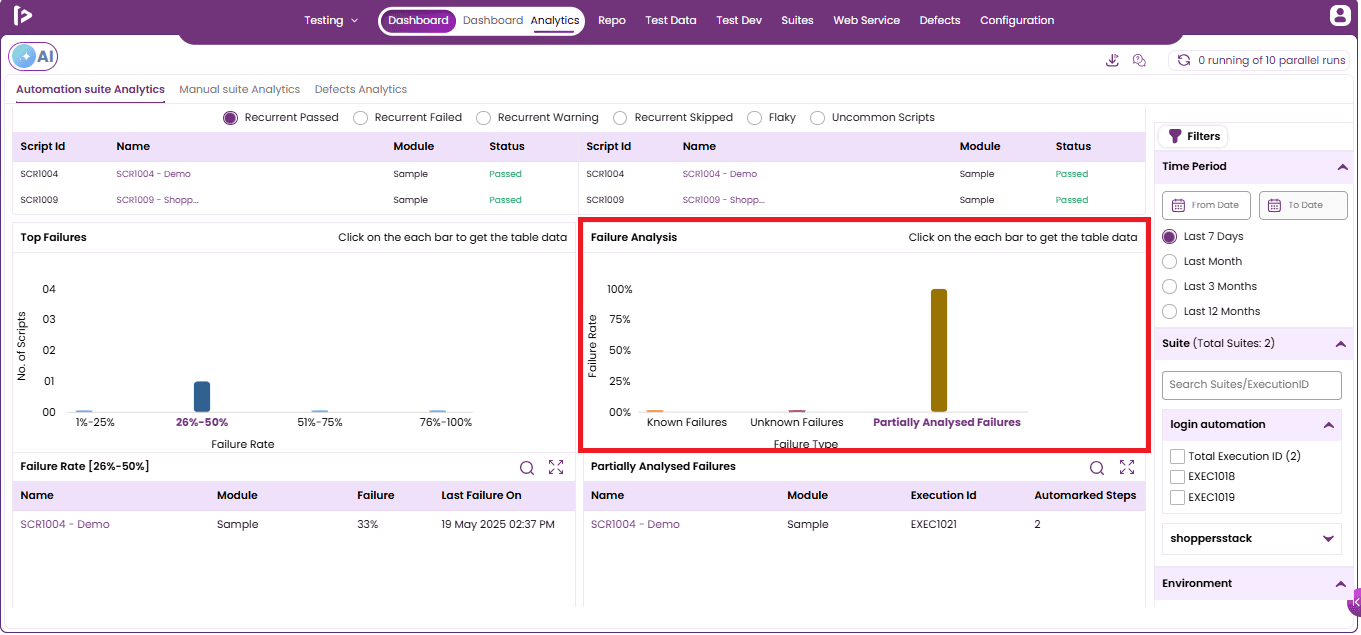
There are 3 types of Failure Analysis. They are as follows;
-
Known Failures - In FireFlink, Known Failures refer to test failures that have already been identified, categorized, and optionally marked to be ignored or notified in future executions. This concept helps teams differentiate between new/unexpected issues and recurring or already-triaged failures, thereby improving the efficiency of debugging and triaging efforts.
-
Unknown Failures - In FireFlink, Unknown Failures are test failures that: Have not been previously encountered or marked as "known." Are new, untriaged, or potential regressions. Require developer or QA attention to investigate their root cause. Are typically highlighted in dashboards and reports to help prioritize debugging.
-
Partially Analysed Failures - In FireFlink, Partially Analyzed Failures refer to test failures that have been reviewed to some extent, but not fully triaged or resolved. These are intermediate-status failures—neither fully “unknown” nor fully “known.”
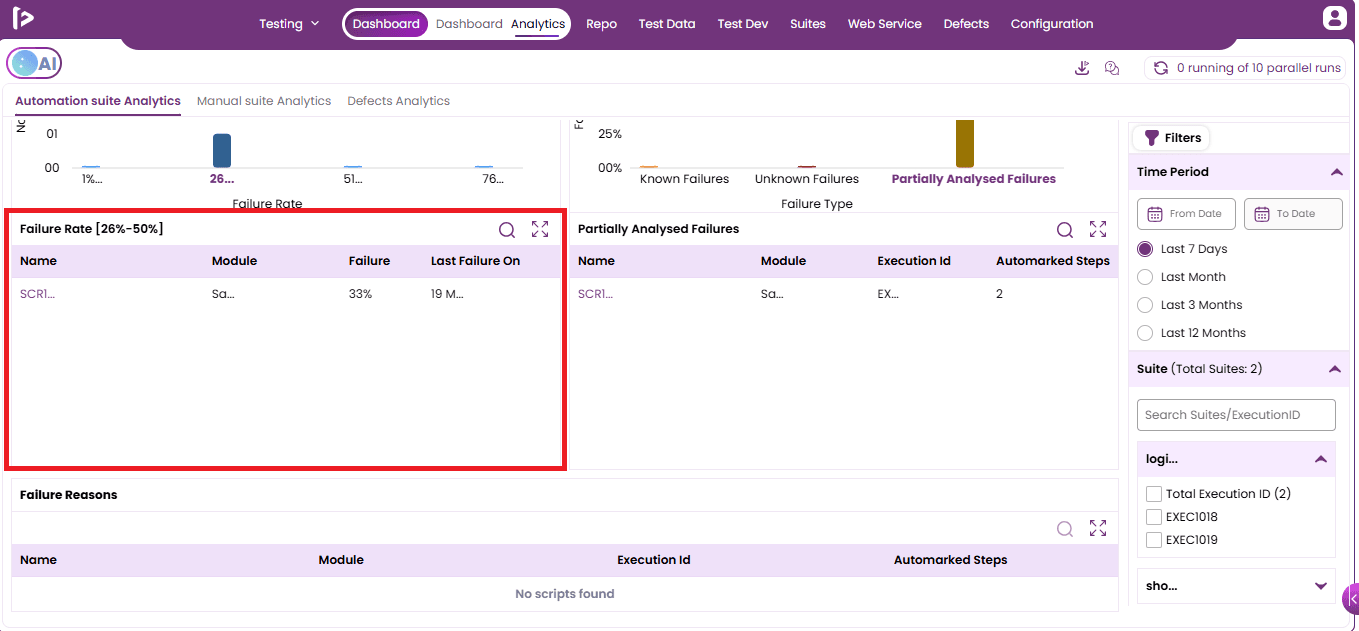
Failure Rate : In FireFlink, the Failure Rate is a key performance metric that reflects the percentage of test cases or scripts that fail during a test execution. Monitoring this rate helps QA and development teams track software quality, identify regressions, and improve test suite effectiveness.
- Columns under Failure Rate are as follows;
- Name - It indicates the name of the script.
- Module - It indicates the module from which the script was selected. For both the columns, modules will be the same.
- Failure - It indicates the failure rate of a particular suite.
- Last failure on - It indicates the date and time of the failure of the suite.
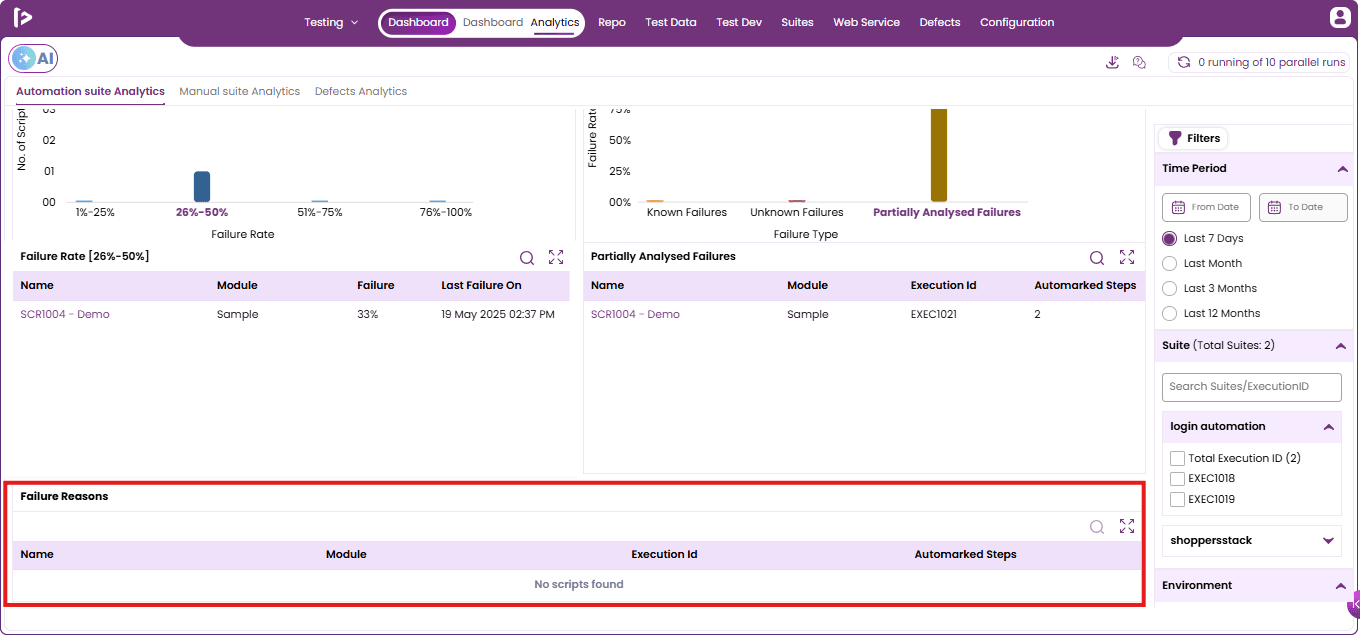
Failure reasons : In FireFlink, the Failure Rate is a key performance metric that reflects the percentage of test cases or scripts that fail during a test execution. Monitoring this rate helps QA and development teams track software quality, identify regressions, and improve test suite effectiveness.
- Columns under Failure Reasons are as follows;
- Name - It indicates the name of the script.
- Module - It indicates the module from which the script was selected. For both the columns, modules will be the same.
- Execution Id - It indicates the execution id of the particular suite.
- Automarked Steps - Automarked Steps refer to test steps that are automatically marked as passed, failed, or skipped by the system based on the outcome of automated test execution—without requiring manual intervention.
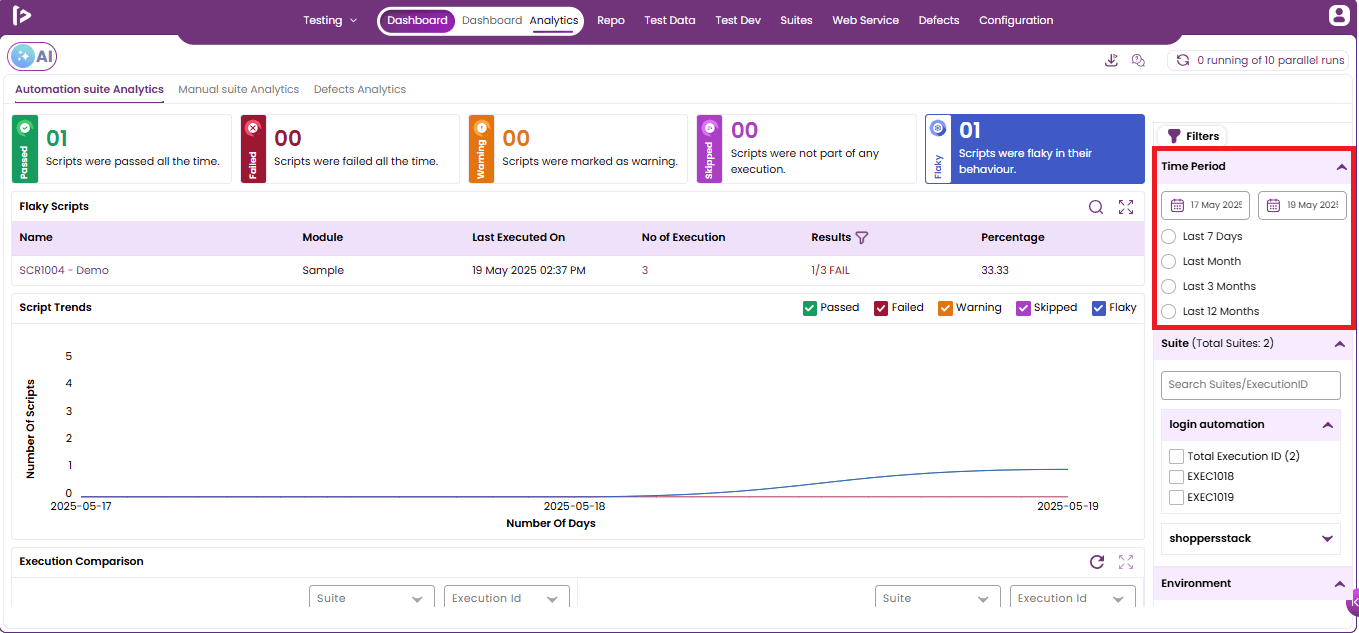
Various Filter options
Time Period : After execution, when a user navigates to the Analytics section, the time period component will expand by default and automatically select the "Last 7 days" option, displaying the analytics report for that period. Users have the flexibility to choose alternative time ranges, such as: Last month, Last 3 months, and Last year. Additionally, users can generate reports for a custom time range by selecting a "From date" and a "To date".
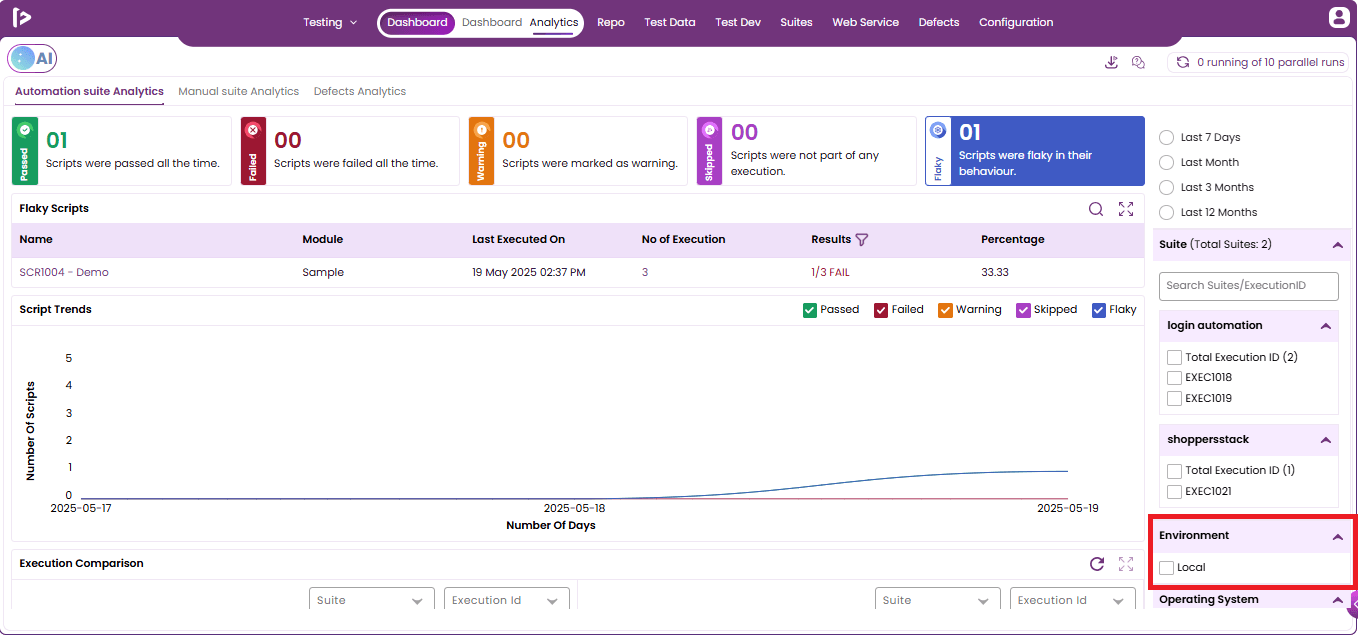
Suites : When the user expands the Suite component, it displays a list of all executed suite files. The user can then select any one of these suites to view its corresponding analytics.
Environment : The available execution environments, such as Local, BrowserStack, and others, will be displayed. Users can initiate execution in a specific environment by simply selecting the corresponding checkbox.
Operating Systems : All available operating systems—such as Windows, Linux, and iOS—will be displayed. Users can select their desired OS by checking the corresponding checkbox.
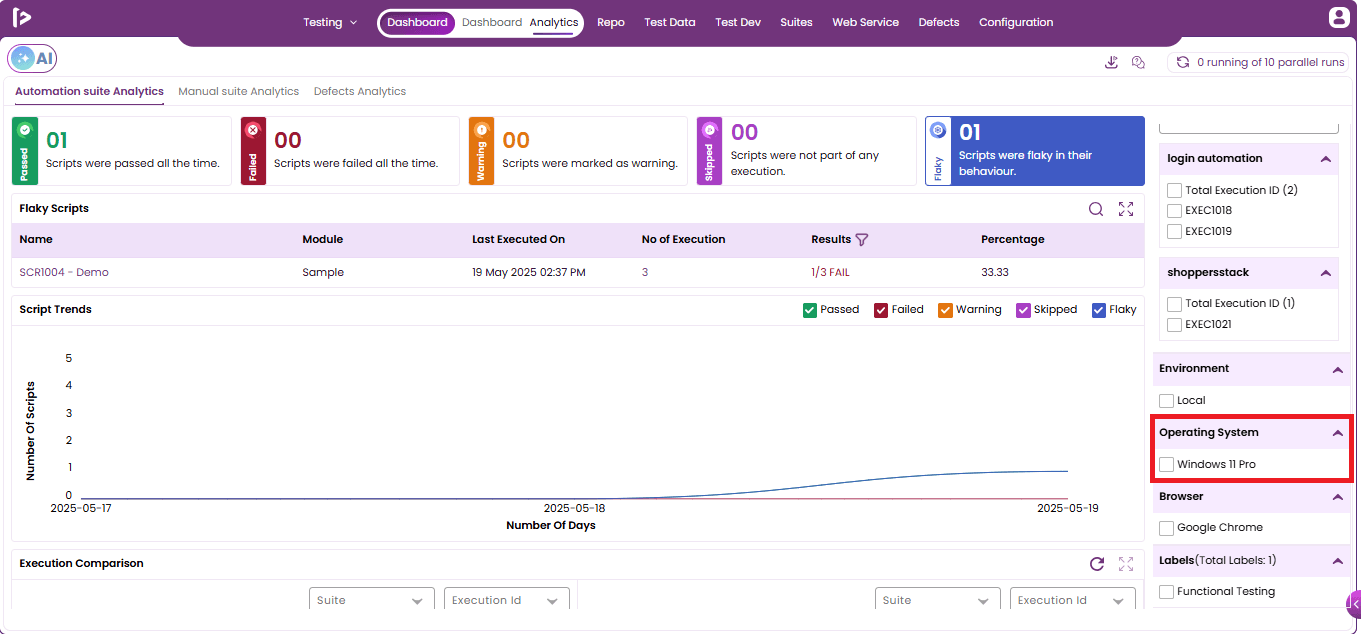
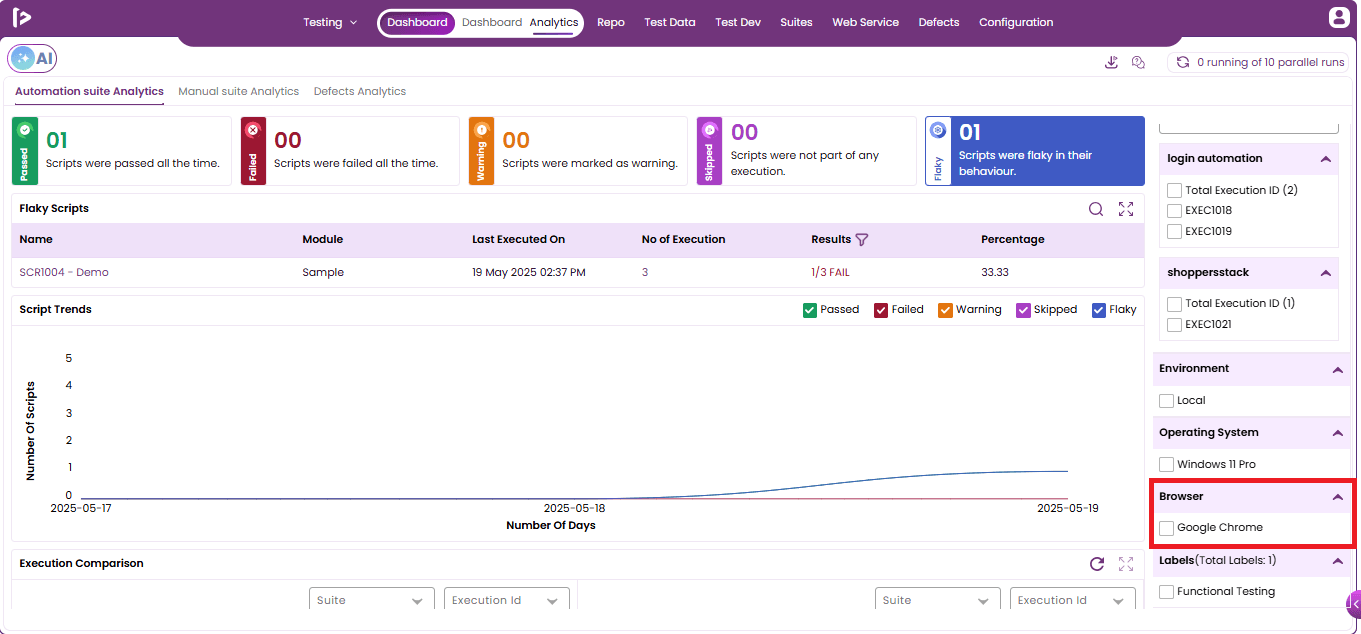
Browser : The Browser section will display all supported browsers, including Google Chrome, Opera, Microsoft Edge, and Mozilla Firefox. Users can select their preferred browser by simply checking the corresponding checkbox.
Labels : Indicates the type of testing being performed for each script within a suite.