Dashboard
The Dashboard provides a centralized overview of key projects and platform resources in a single view. It enables users to quickly monitor projects, users, machines, and memory utilization through clear visual summaries and charts.
- Projects – Displays the total number of projects along with their types and current statuses such as open, closed, or archived.
- Users – Displays user roles (Super Admin, Admin, User) and their activity status.
- Machines & Clients – Provides information about available machines, including their access status, operating systems, and supported browsers used for test execution.
- Memory Usage – Displays total available memory, assigned memory, and actual consumption, along with project-wise memory allocation and usage trends.
The dashboard helps users quickly assess system status and efficiently manage resources at a glance.
Navigation
Steps to navigate to All Projects Level Dashboard
- Log in to FireFlink, the user will be landed on the "All Projects" Level by default.
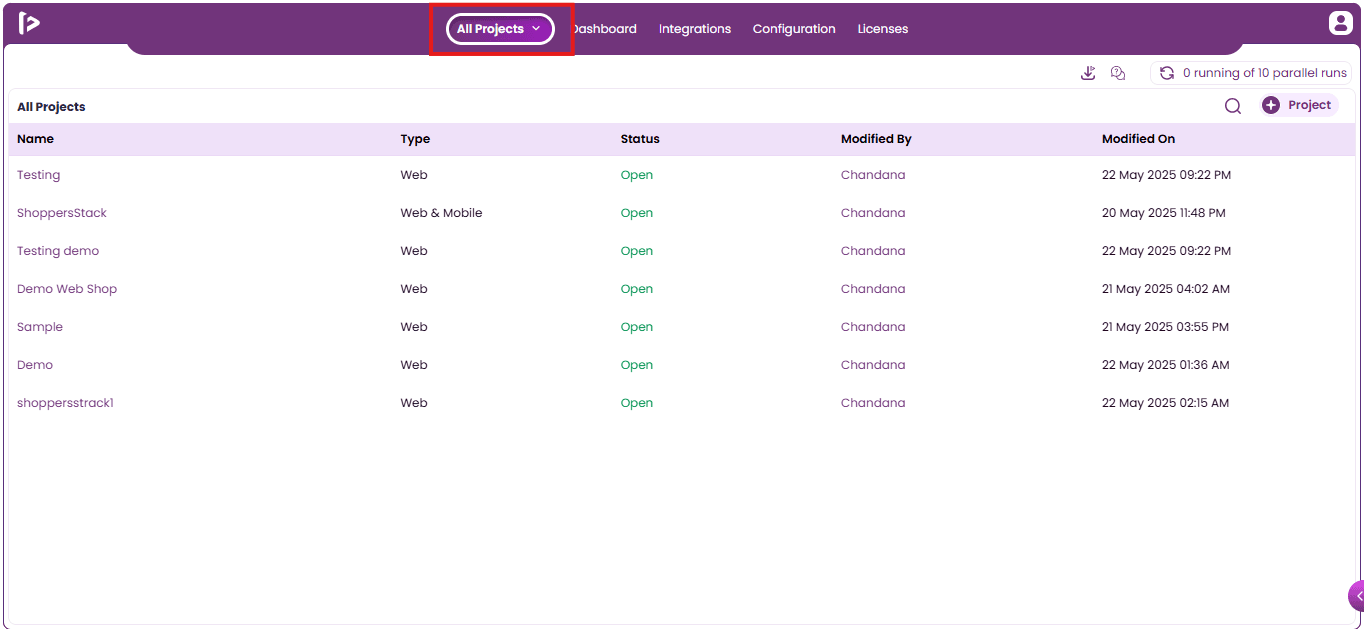
- Click on "Dashboard" from the top navigation bar, the user will be navigated to the Dashboard page.
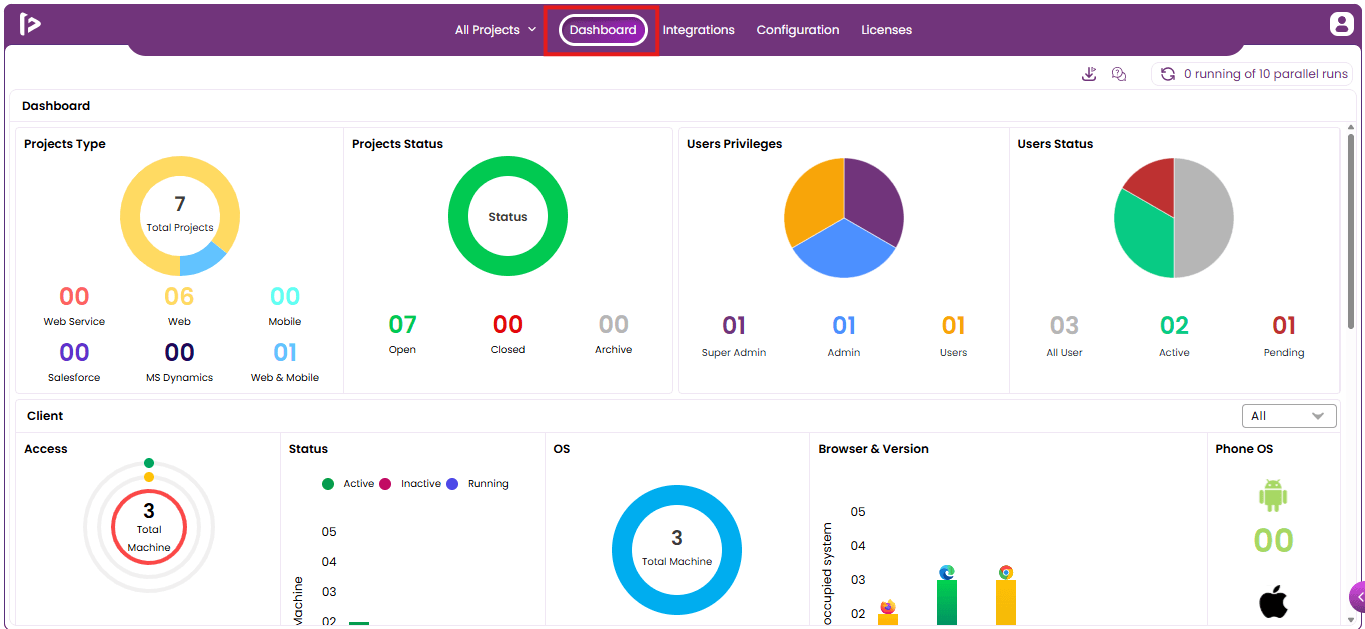
Dashboard Overview
At the "All Projects" level, users can view a comprehensive overview of all projects available under the license.
-
The dashboard presents key insights, including project counts by type, project status distribution, user counts based on status and privileges, client machine information, and license storage details.
-
If no projects have been created, the dashboard will appear empty, indicating that no data is currently available.
The dashboard is organized into various categories, offering a clear and interactive overview.
- Projects: This category is divided into two key sections:
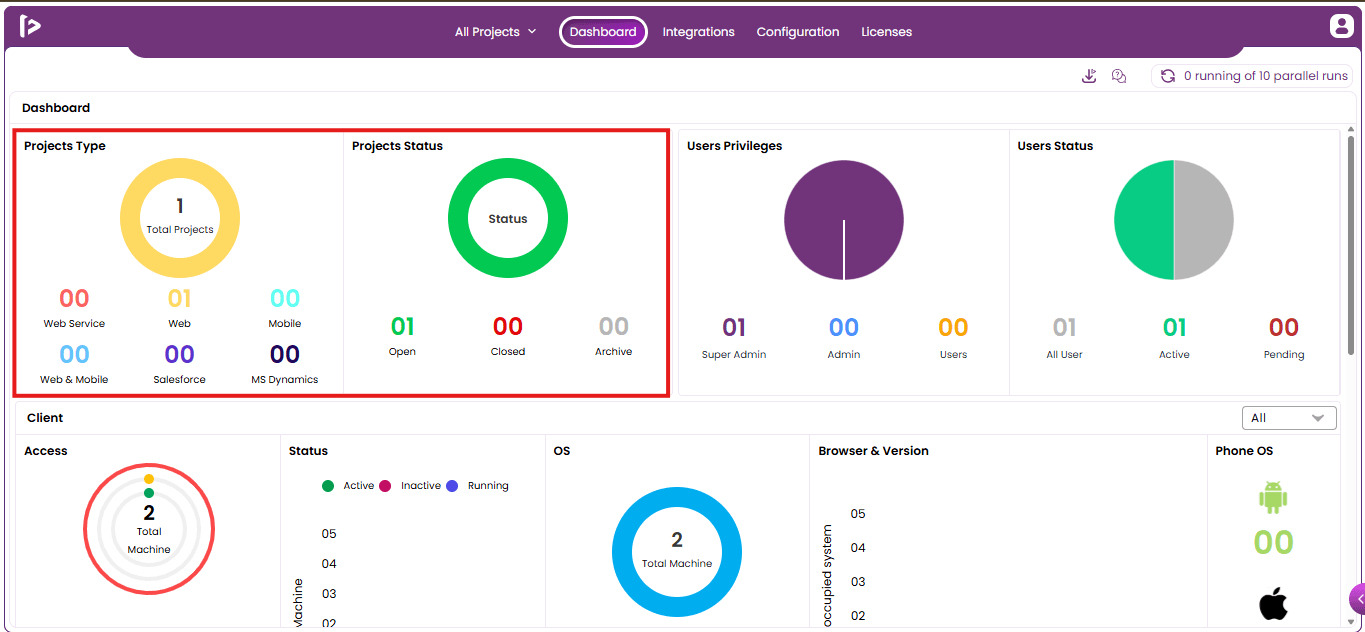
Types – This section displays different project types such as Web Services, Web, Mobile, Web & Mobile, Salesforce and MS Dynamics, along with the count of projects under each type.
- These are visually represented using a Donut Chart. At the center of the chart, the total number of projects across all types is shown.
- When you hover over any section of the chart, it highlights that specific project type and shows the number of projects associated with it—for example, hovering over "Web" will display the total number of web projects.
Status – This section illustrates the current status of projects—Open, Closed, or Archived—using a Pie Chart.
- When hovering over a specific segment, the chart highlights the selected status and displays a tooltip with the corresponding count.
- This interactive chart provides a quick and clear snapshot of how many projects fall under each status category.
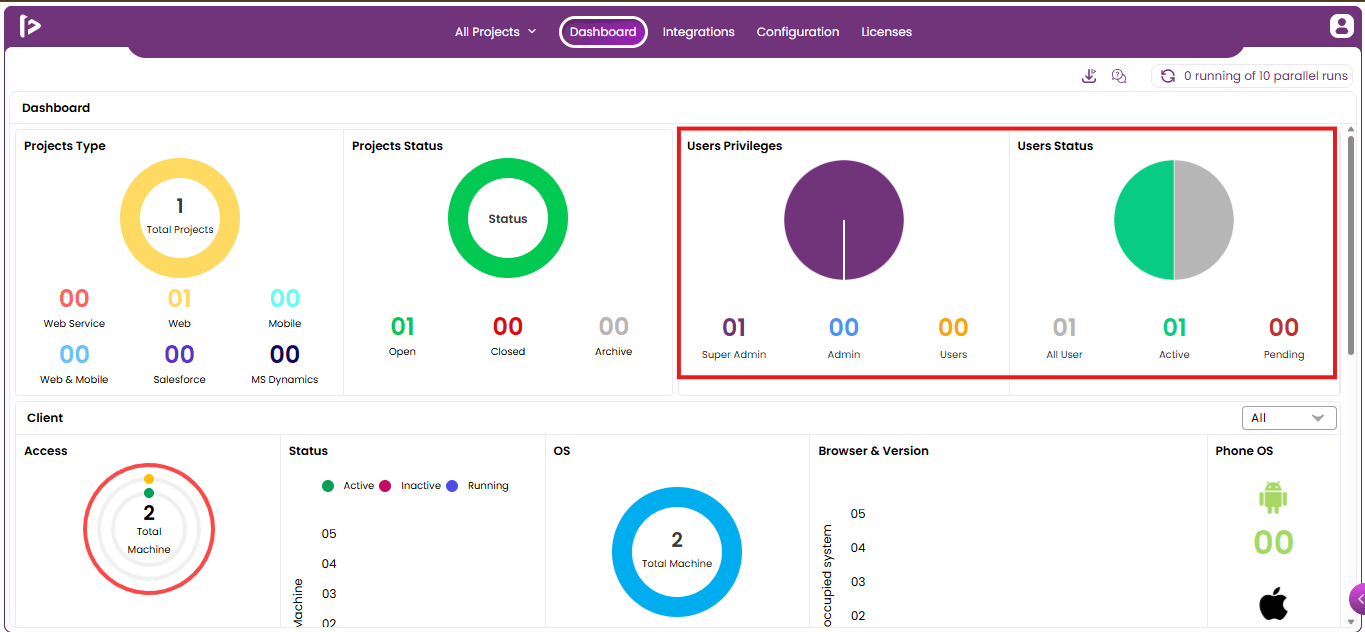
2. Users: This section displays detailed information about user' "Status" and "Privileges" within the project.
-
Status – The status of users associated with the project is illustrated using a Donut Chart, showing categories such as "All Users", "Active", and "Pending".
- When a user is added to a license but has not yet activated their account, they appear under "Pending".
- Once the account is activated and the user successfully logs in, their status updates to "Active".
-
Privileges – This section is represented with a Pie Chart, highlighting the distribution of user roles, including "Super Admin", "Admin", and "User".
- These privileges are assigned at the time of adding users to a license.
- It’s important to note that each license allows a maximum of "two Super Admins".
Note : This section provides a quick visual breakdown of both user activity and role allocation within the system.
3. Client: This section provides insights into project data categorized by operating systems (OS). A dropdown menu allows users to select a specific OS and view relevant project information based on the selected platform. This helps users analyze client environments and improve platform-specific test coverage.
The Client section includes the following subcategories:
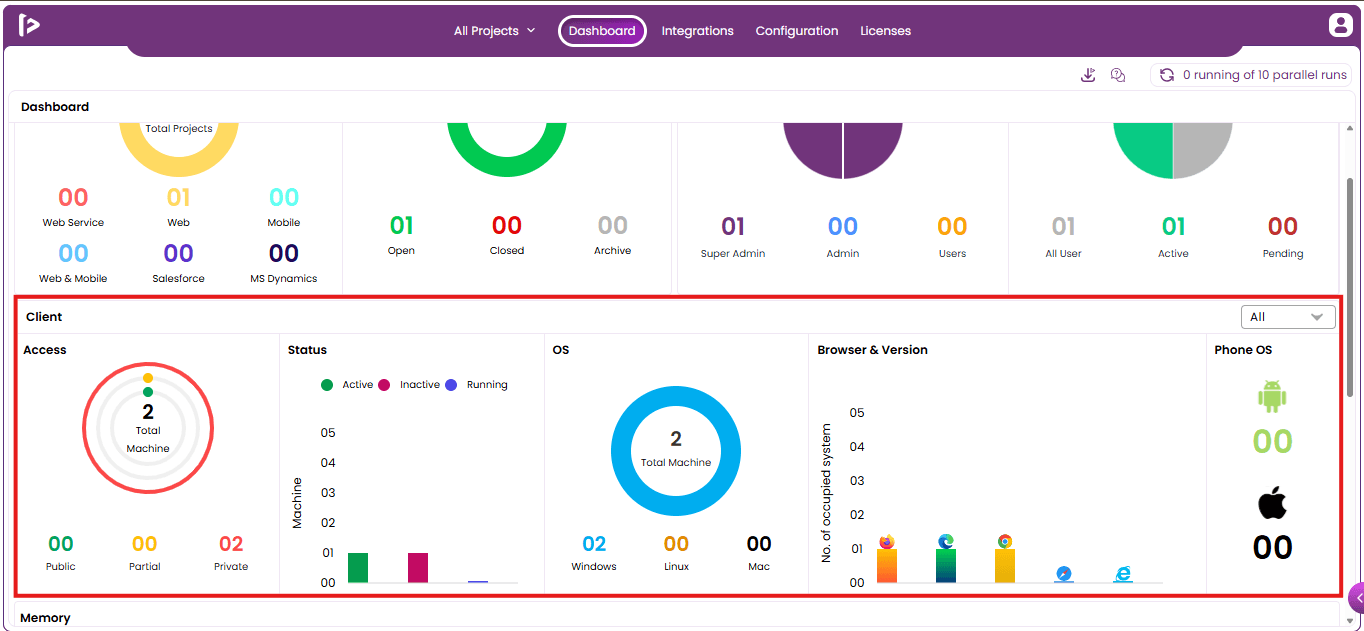
- Access – Depicted using a Bar Chart, this subcategory highlights the distribution of systems categorized as Private, Partial Public, and Public.
- Status – This shows the client status as Active, Inactive or Running using the bar graph.
- OS – Displays different operating systems such as Windows, Linux, and Mac, visualized through a Donut Chart. When a user selects an OS like Mac from the dropdown, detailed version-specific information for that OS is shown.
- Browser & Version – Shows the count of various browsers used along with their corresponding versions, helping users understand browser-specific usage trends.
- Phone OS – Presents data on the number of connected Android and iOS devices, including details about their versions.
4. Memory: This section provides an in-depth view of the memory allocated to the current license. On the right side, users can view "Consumption Statistics", which track memory usage across various timeframes "This Week", "Month", "Year", and "All Time".
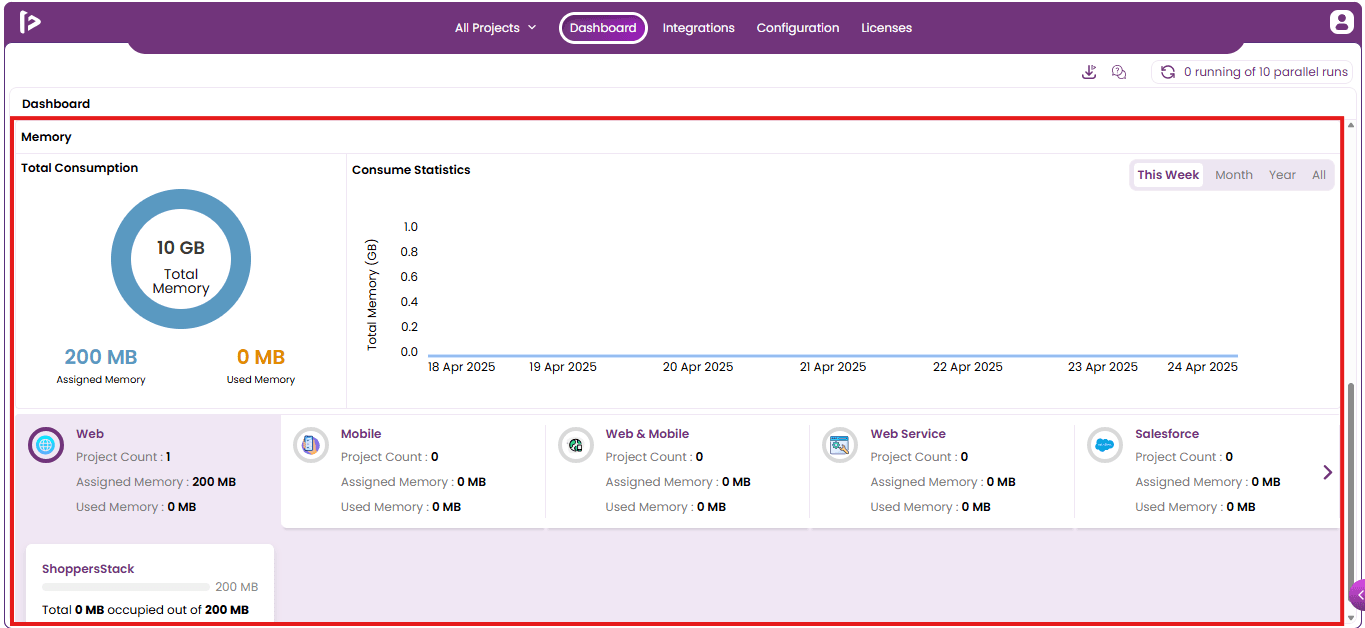
- Total Consumption – Displays the overall memory distribution, including "Total Memory", "Assigned Memory", and "Used Memory" for all projects under the license.
- Consumption Statistics – Breaks down memory usage patterns over "daily", "weekly:, and "monthly" intervals, offering a clear view of consumption trends.
- Beneath the Memory section, the user will find expandable cards for each project type (e.g., Web, Mobile, etc.). Each card includes an expand icon on the right.
- When clicked, it reveals memory details for all projects associated with that particular project type.
- For instance, clicking the Web project card displays memory usage data for all Web-type projects.
NOTE:
- A Free Trial license comes with 2GB of memory storage.
- A C - Professional license includes 5GB of memory storage by default, it can be extended.